Turn Data Into Clear Visual Stories.
STATCAL ONLINE Visualization brings together focused, browser-based tools for transforming data into clear, customizable, and publication-ready figures. The visualizers are designed to support research, teaching, presentations, academic reports, and scientific publications through practical and interactive visualization workflows.
Explore Visualization Tools
Select a visualization family based on the analytical story you want to communicate. Each tool provides a focused workflow for creating clear, flexible, and publication-ready visual output.
Categorical & Distribution Visualization
Visualize frequencies, percentages, category composition, and survey response patterns using stacked bars, categorical bars, pie charts, donut charts, and related circular displays.
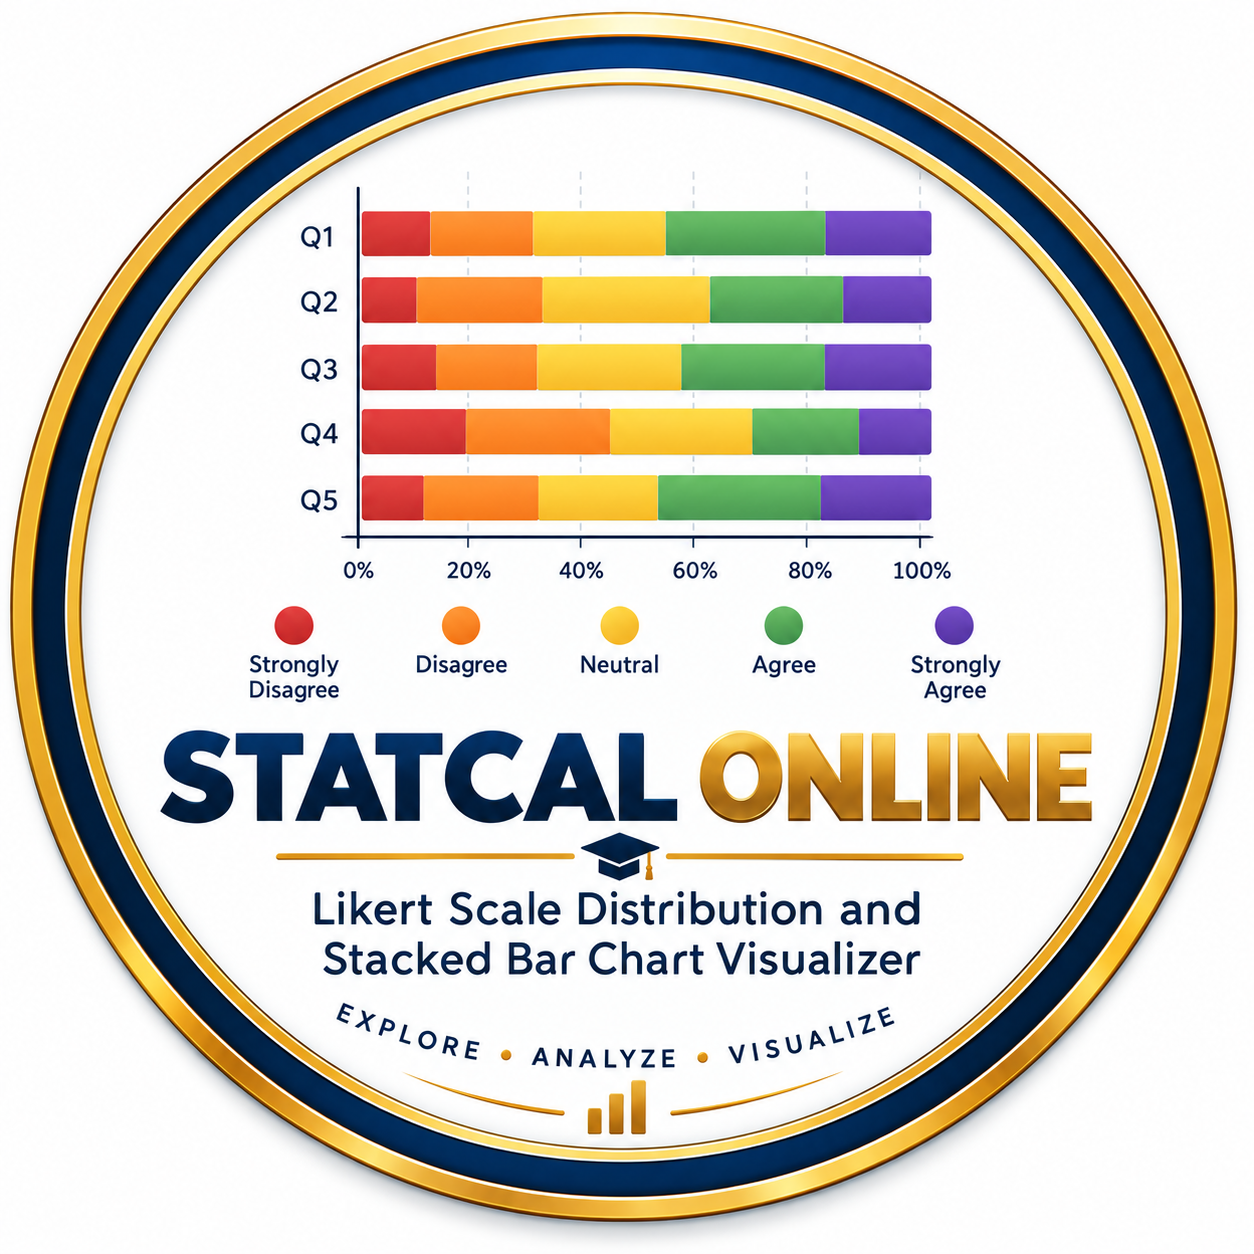
Likert Scale Distribution and Stacked Bar Chart Visualizer
Visualize Likert-scale response distributions using clear, customizable stacked bar charts for survey and questionnaire data.
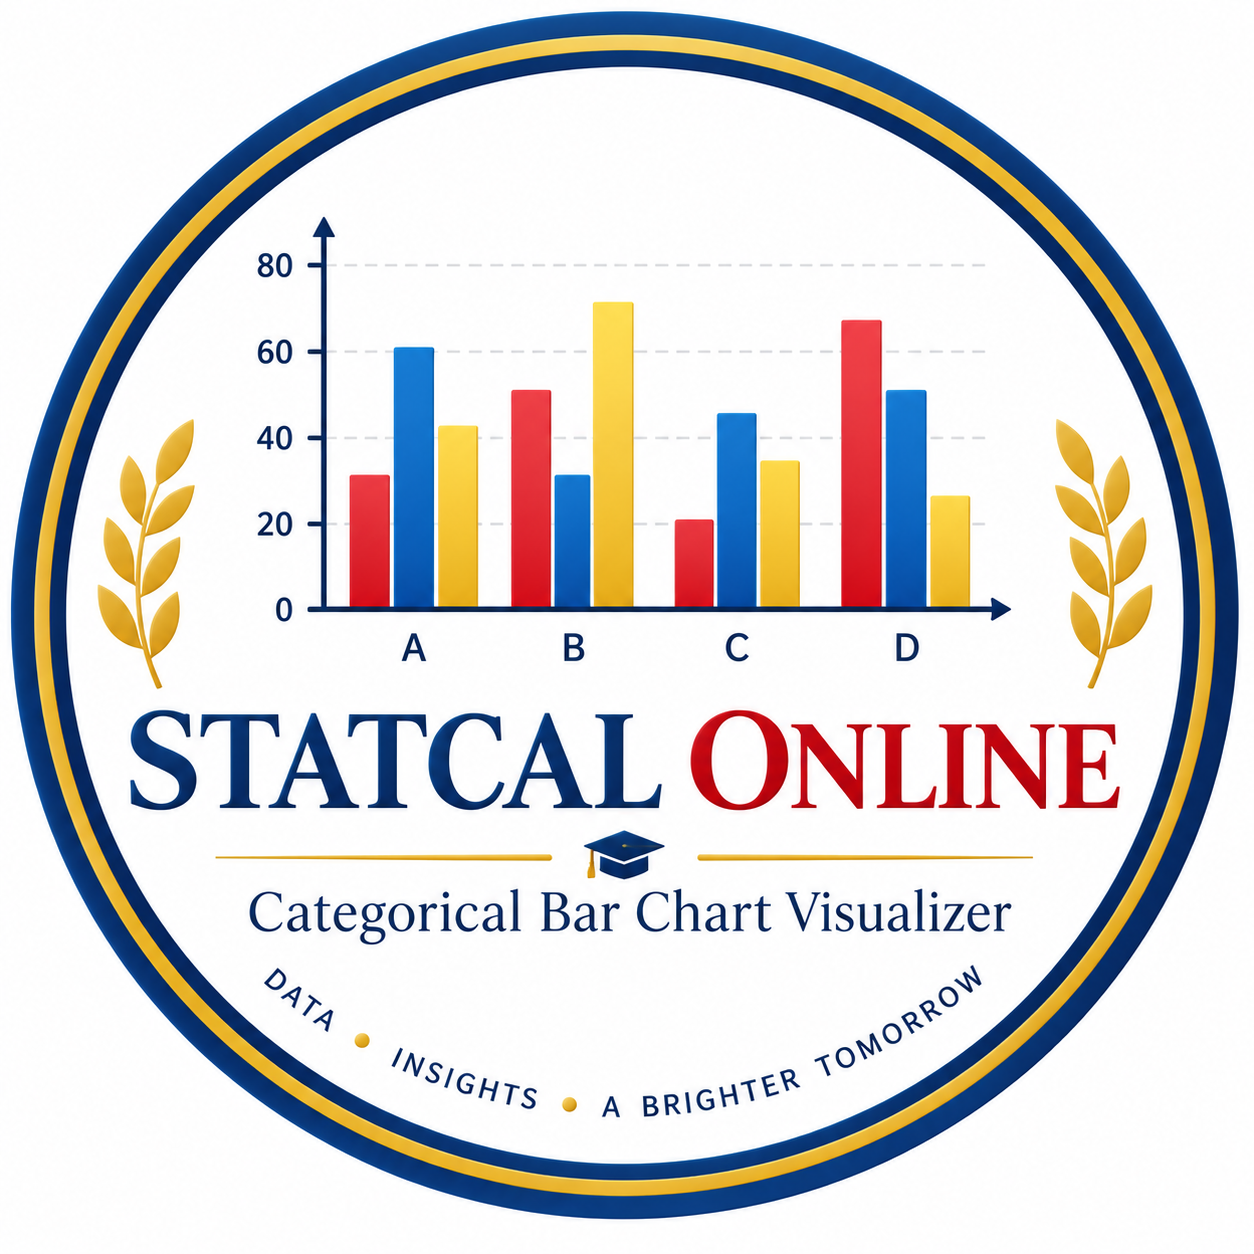
Categorical Bar Chart Visualizer
Analyze categorical data using frequency and percentage tables, stacked, 100% stacked, side-by-side and simple bar charts, univariate and bivariate views, split panels, and publication-ready export.
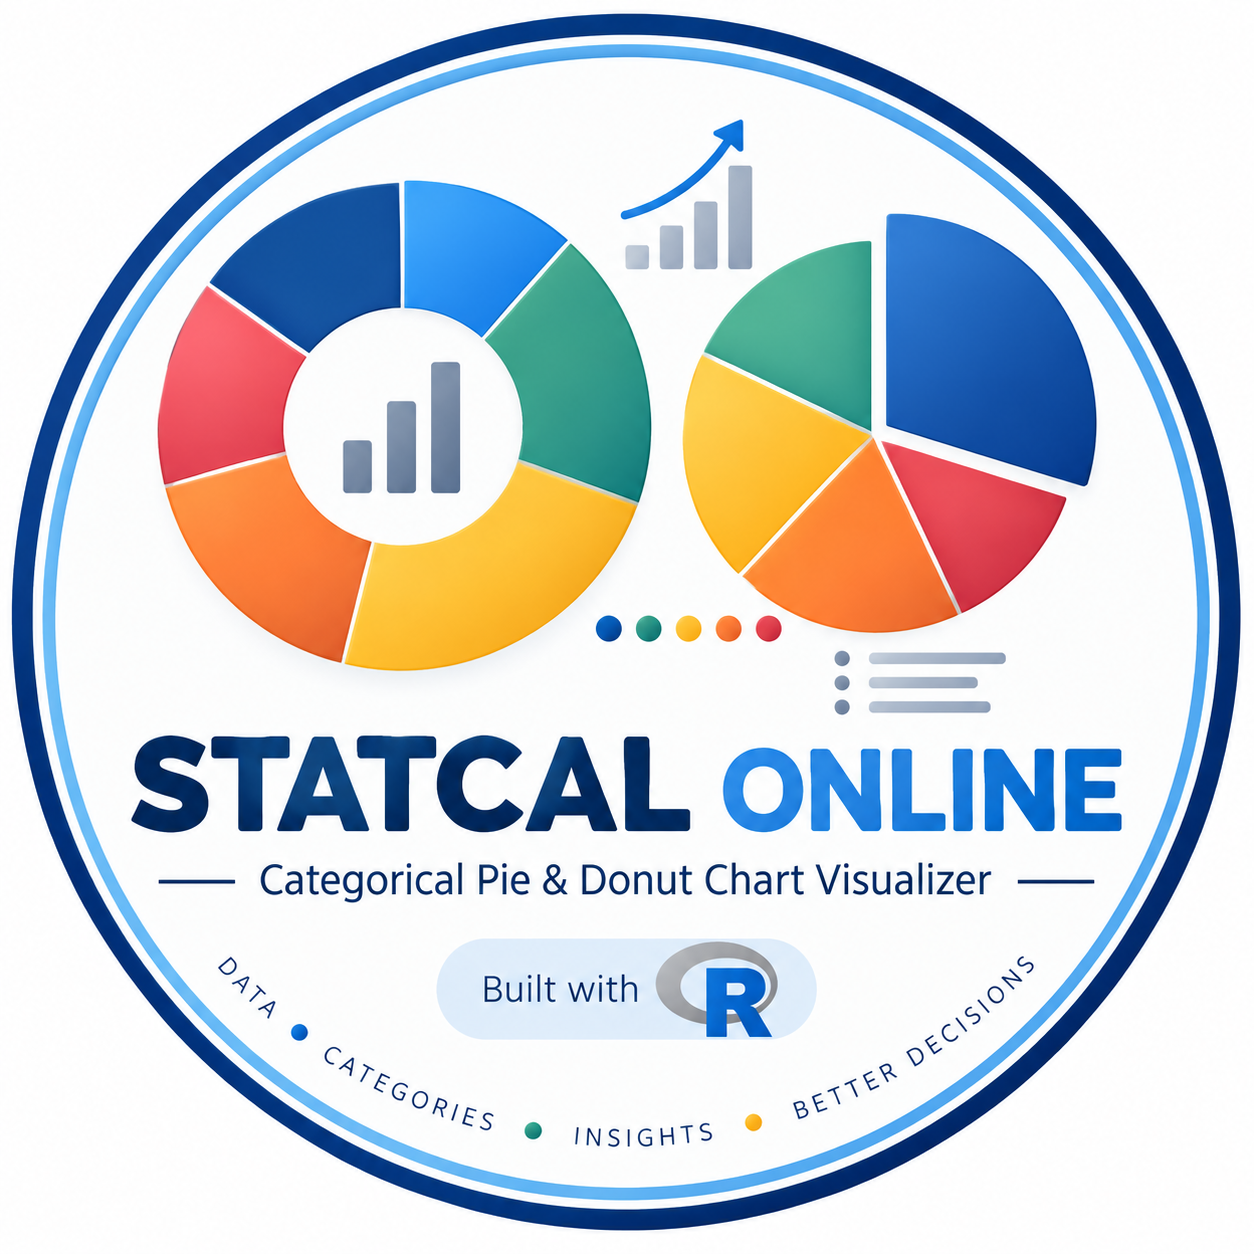
Categorical Pie & Donut Chart Visualizer
Explore categorical distributions using flexible pie charts, donut charts, rose/polar charts, multi-ring visualizations, bivariate circular comparisons, split panels, and publication-ready PNG, Excel, and Word outputs.
Numeric Distribution & Group Comparison Visualization
Explore distributions, numeric profiles, variability, and group differences using boxplots, mean-profile line charts, uncertainty displays, grouped comparisons, and flexible split-panel visualizations.
Mean Profile Line Chart Visualizer
Visualize mean profiles across multiple numeric measures, compare categorical groups, split profiles into flexible panels, control ordering and styling, add points and uncertainty displays, and create publication-ready outputs.
Boxplot Visualizer
Explore numeric distributions with flexible boxplots, jitter points, outlier controls, violin layers, mean and uncertainty overlays, grouped comparisons, multi-scale variables, and one- or two-category split panels.
Relationship & Correlation Visualization
Explore statistical relationships, correlation structures, and multidimensional numeric patterns through matrices, heatmaps, correlograms, scatterplots, bubble charts, regression overlays, and grouped comparisons.
Correlation Matrix and Scatterplot Visualizer
Explore relationships among variables through correlation matrices, significance tables, correlation heatmaps, and publication-ready scatterplots for Pearson or Spearman analysis.
Correlation Matrix Visualizer
Explore correlation structures using Pearson or Spearman matrices, significance testing, split analysis, heatmaps, bubble matrices, mixed correlograms, and descriptive difference matrices across groups.
Scatterplot Visualizer
Explore relationships between numeric variables using single or multiple scatterplots with correlation, regression or LOESS, categorical colors and shapes, split-panel comparisons, and flexible export.
Bubble Chart Visualizer
Create flexible publication-ready bubble charts using numeric X and Y variables plus a third numeric variable mapped to bubble size; compare groups, split by one or two categories, use fixed or free panel scales, control bubble size manually, and export PNG, Excel and Word.
Comparative & Demographic Visualization
Compare groups and categories or communicate demographic structure using focused visual tools designed for clear side-by-side interpretation.
Lollipop Chart Visualizer
Compare categories with clean and expressive lollipop charts. Customize grouping, panels, ordering, highlights, reference lines, labels, and publication-ready outputs.
Population Pyramid Visualizer
Create clear population pyramids for two-group demographic comparisons with flexible categories, frequencies or percentages, panel layouts, styling controls, and publication-ready outputs.
Designed for Practical Data Communication
STATCAL ONLINE Visualization focuses on making statistical graphics easier to create, customize, interpret, and communicate.